Thursday, 24 November 2011

Frequency of labels for all users

I attended a probability lecture today. This probability course would be supposed to cover a whole range of anything related to distribution. Hence, the material is useful, but it is hard to follow.

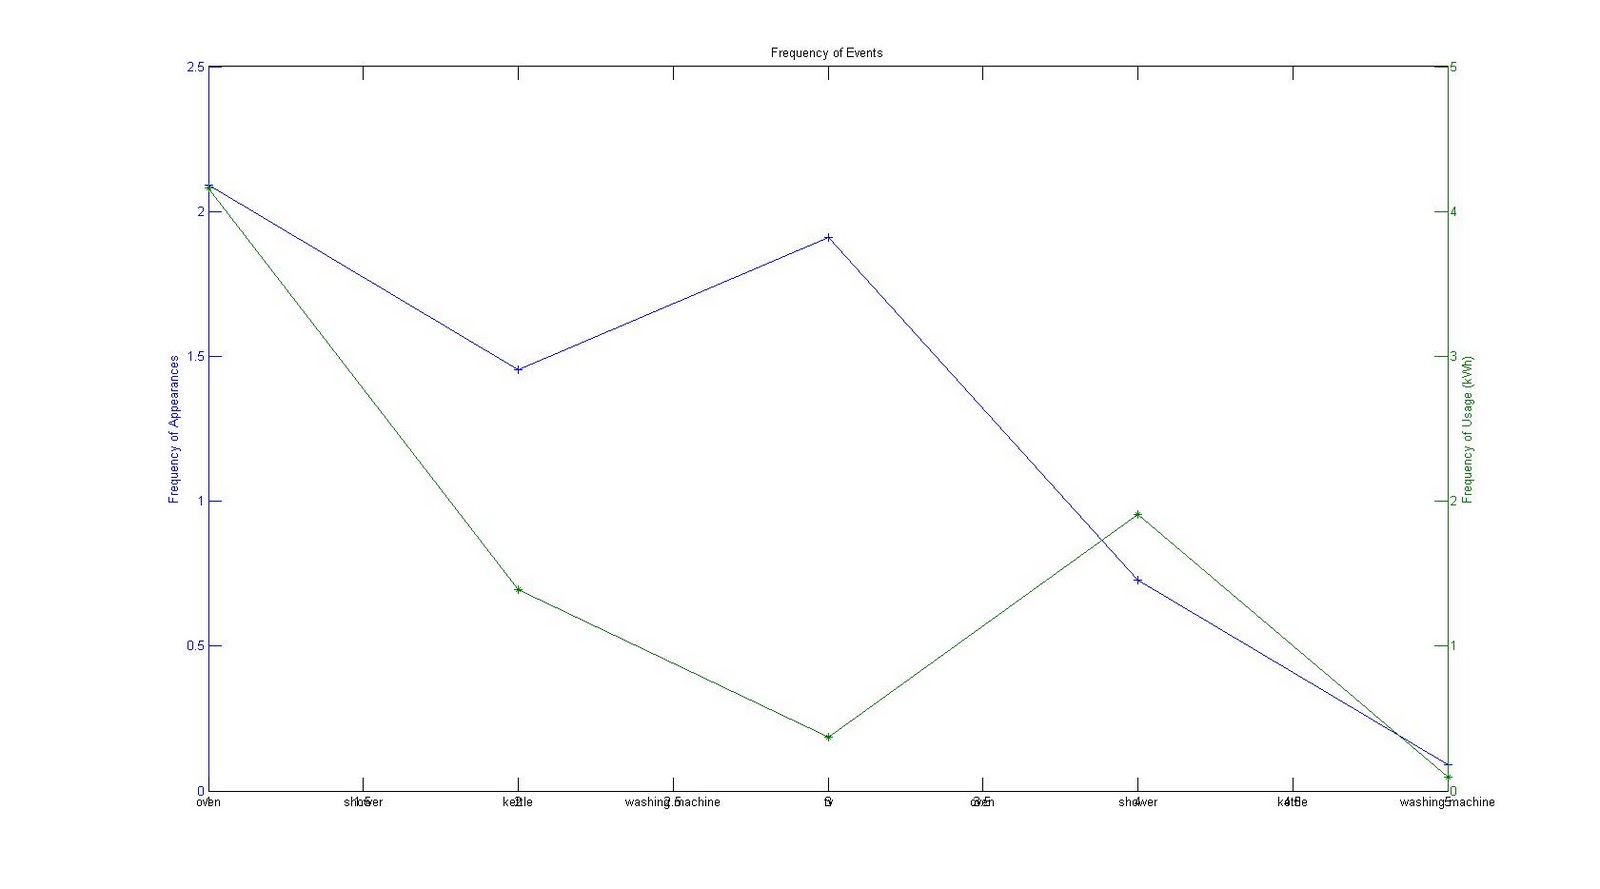
Back to FigureEnergy data analysis, I plotted the frequency of labels per day for all users. The result is showed in Figure 1.0 as follows:

Figure 1.0 Frequency of labels appearances per day for all Users
I think Poison process can help to estimate the labels in the future based on the frequency of the appearances of labels. The annotated events data in FE seems so much noise, therefore we need to define a method the automatically recognise the events.
In addition, I will try to implement Poison process on the energy consumption, where the energy usages can be divided into smallers segments of energy usage. By using Poison process, I hope it can tell the highest probability of particular segment of energy usage for the given time.

Tuesday, 22 November 2011

Frequency of events analysis

Different users have a list of their own activities during a day. These activities might have a chance to regconise as a pattern. To analyse this, we take the events which annotated from the real users during the FigureEnergy experiment to check the frequency of the type of events per day in term of appearance and energy usage. The results are shown as follows:

Figure 1. Frequency of events for user ecenergy22

Figure 2. Frequency of events for user ecenergy23

Figure 3. Frequency of events for user ecenergy24

Figure 4. Frequency of events for user ecenergy25

Figure 5. Frequency of events for user ecenergy30

Figure 6. Frequency of events for user ecenergy33

Figure 7. Frequency of events for user ecenergy34

Figure 8. Frequency of events for user ecenergy36

"Average Day" data again in weekday and weekend

I have plotted the "average day" usage again in weekday and weekend days from several users. The results are shown as follows:

Figure 1. Average day usage for user ecenergy22
Figure 2. Average day usage for user ecenergy23

Figure 3. Average day usage for user ecenergy25

Figure 4. Average day usage for user ecenergy30

Figure 5. Average day usage for user ecenergy32

Figure 6. Average day usage for user ecenergy33

Figure 7. Average day usage for user ecenergy34

Figure 8. Average day usage for user ecenergy35

Figure 9. Average day usage for user ecenergy36

Figure 10. Average day usage for user ecenergy37

Figure 11. Average day usage for user ecenergy38

Figure 12. Average day usage for user ecenergy39
The graph for those users above could be different if their usage data can be collected in at least 4 weeks.

Friday, 18 November 2011

Meeting notes on 18/11/2011 (Revised version)

1 – List of Tasks from previous meeting:
      ·         Post a research plan in blog.

·         Plot user consumption hourly for some specific days.

·         Plot average day on different users.

2 – Discussion:

I have done all the previous tasks. Each individual user has a different profile of energy usage in “average day”. We might guess the energy behaviour and user’s lifestyle based on looking on these graphs.
 
3 – List of next tasks (sorted in order of priority)

·         Calculate and plot user consumption in “average day” again in week days and weekend days.

·         Plot frequency (on all labels) per day. Look further into the idea of detect the peak usage, from different thresholds.

·         Look further into detect events, based on peaks. Check the different signal, where y(t) = x(t) – x(t-1), where 1 is a time unit (currently time unit is 2 mins in FigureEnergy). Check to see if “low pass frequency” can apply anywhere in this part. Be aware of two types of statistics: user annotation, and peaks (e.g., washing machine has 2 peaks).

·         Research on Google scholar for “event prediction Gaussian”, predicting faults in machinery, and predicting “network traffic” and post what you would have found.

·         Look at “Poison process” in the wiki, check the relevant papers.

·         Read and summarise 1-2 papers weekly.

·         Try to find existing works in a different domain and translate those models to our situation, typically 2-3 existing models.

·         Look and report on research where agents to keep calendars and agents to book rooms. (probably from http://teamcore.usc.edu/)

·         Prepare an email to ask agent’s research fellow (Sid, Rama, Greg) to ask about their suggestion on the relevant mathematical model that I should use.

·         Prepare an email and a dataset (in .csv format) to send to Steve Reece about how to proceed with the prediction.

·         Improve English (I have attended the Academic Writing English course (1 hour/week, in 6 weeks), however I found it would not help much in my situation. It showed some principle of how to make a good writing structure and talk a bit about everything, but it is not enough for me. I think I might look for a paid tutor to improve this weakness. At the time being, I will try to revise my blog and might get someone to check the writing. I might need to read at Oli’s blog to learn the informal writing style as well).

·         Optional:

·         Register course in probability

·         Register online course in Machine Learning (web-seminar from Stanford University)

·         Read paper: “A decision-Theoretic Approach to Cooperative Control and Adjustable Autonomy”

Pre-meeting notes on 18/11/2011.

1 – List of Tasks from previous meeting:

·         Post a research plan in blog.

·         Plot user consumption hourly for some specific days.

·         Plot average day on different users.


2 – Discussion:

I have done all the previous tasks. Each individual user has a different profile of energy usage in “average day”. We might guess the energy behaviour and user’s lifestyle based on looking on these graphs.


3 – List of next tasks (sorted in order of priority)

·         Calculate and plot user consumption in “average day” again in week days and weekend days.

·         Research on Google scholar for “event prediction Gaussian”, “predicting faults in machinery”, and predicting “network traffic” and post what you would have found.

·         Try to find existing works in a different domain and translate those models to our situation, typically 2-3 existing models.

·         Look and report on research where agents to keep calendars and agents to book rooms.

·         Look for the existing infrastructure on Google calendar, ICS format.

·         Prepare an email and a dataset (in .csv format) to send to Steve Reece about how to preceed with the prediction.

·         Improve English (I have attended the Academic Writing English course (1 hour/week, in 6 weeks), however I found it would not help much in my situation. It showed some principle of how to make a good writing structure and talk a bit about everything. I think I might look for a paid tutor to improve this weakness).

·          Look into frequency in term of user-generated events, the basis of power level, or the time it takes between two instant where power goes above x.

·         Optional:

·         Register course in probability

·         Register online course in Machine Learning (web-seminar from Stanford University)

·         Read paper: “A decision-Theoretic Approach to Cooperative Control and Adjustable Autonomy”

"Average Day" data plotting.

I have plotted an energy consumption of "average day" for different users. The results will be shown as follow:
Figure 1.0 - Average Day consumption for User ecenergy22 in 14 days
Figure 2.0 - Average Day consumption for User ecenergy23 in 11 days
Figure 3.0 - Average Day consumption for User ecenergy24 in 10 days
Figure 4.0 - Average Day consumption for User ecenergy25 in 7 days
Figure 5.0 - Average Day consumption for User ecenergy30 in 7 days
Figure 6.0 - Average Day consumption for User ecenergy32 in 18 days
Figure 7.0 - Average Day consumption for User ecenergy33 in 17 days
Figure 8.0 - Average Day consumption for User ecenergy34 in 11 days
Figure 9.0 - Average Day consumption for User ecenergy35 in 11 days
Figure 10.0 - Average Day consumption for User ecenergy36 in 12 days

Friday, 11 November 2011

Hourly consumption analysis

I have calculated an energy of user consumption in every hour to see if we can observe any patern, which could help to improve the prediction. I firstly run a whole data of user ecenergy22. The result can be seen in Figure 1.0 below:

Figure 1.0 User consumption in every hour.

Then, I generate the results in the first 13 days for an ease of observation. The following figures shows the daily user consumption in every hour unit.
Figure 2.1 User consumption on 06/09/2011.

Figure 2.2 User consumption on 07/09/2011.
Figure 2.3 User consumption on 08/09/2011.
Figure 2.4 User consumption on 09/09/2011.

Figure 2.5 User consumption on 10/09/2011. 
Figure 2.6 User consumption on 11/09/2011
Figure 2.7  User consumption on 12/09/2011.