In the past, I have used a model, called "Mixture model of EGHs" to predict the next activity ahead. The idea is to analyse the past occurrences of the target event that we would like to predict. By looking the preceding window of the past occurrences, we can create a single sequence of these preceding sequences. The statistical mixture model could be generate to summarise this training dataset, so we can use this model to predict whether or not the target event would occur in the next time slot, given the recent window sequence of events.
The original algorithm of mixture model of EGHs considers all the occurrences of the events in the past. By applying to the home energy management scenario, we have observed that the day of the week is one of the important factor for the homeowners to decide which appliances/events/activities they could use. For example, the activities are obviously different between weekdays and weekends. This is because the homeowner' behaviours can be impacted by others external factors such as local weather, working hours, social activities.
Thus, taking the weekday as an important factor to predict the future events/activities, we can extend EGH algorithm. Instead of computing all past occurrences of the target event (i.e., the event that we would like to predict), we only consider the past occurrences that occurred to the same weekday that we would want to predict.
For example, if we want to predict occurrences of "washing machine" on next Tuesday, we only analyse the past preceding sequences that had the "washing machine" running on Tuesday.
By doing so, we might catch the patterns between appliances/activities and improve the prediction.
As the human's routines are best described daily, and weekly. The size of preceding window should be 7 days (1 week).
I have finished the code. Debugging at the moment...
Wednesday, 3 October 2012


Friday, 28 September 2012
Empirical Analysis
Having applied two state of the art algorithm from two other domains, I found that these algorithms might not work well in my home energy management scenario and could be difficult to extend the models because I don't have a clear idea how the real energy consumption activities performed in the home. Thus, I decided to go back to the real data and do some empirical analysis on some devices with the hope that I could find something interesting.
I started with the REDD dataset, with a couple of devices such as dishwasher, oven, and microwave. I converted the raw data into a list of ON-OFF events. Each event has a set of parameters such start time, duration, energy consumption. For example, the performance of the dishwasher of one house in REDD data can be seen as follows:

So, we can draw a dishwasher's distribution, which is looked like as follows:

This distribution does tell us that the dishwasher is most used between the consecutive days.
I have read a paper which mentioned that human's behaviour is on weekly (or daily) routines, so it does have some degree of regularity and predictability. And future prediction must be based on the assumption of determinism, so that the future events can be dependent on past events. Following to this idea, I convert from one single-dimensional time series into two dimensional matrix of weekdays and the state of the week that the event is turned ON-OFF. The data can be seen as follows:
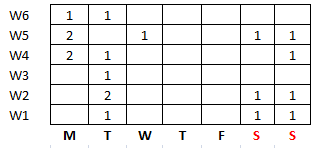 In this table, we can see quite clearly that the user does not use the dishwasher on Thursday, and Friday, and likely to use once between Monday, and Tuesday. Also, he is likely to use in the weekend. The pattern is quite apparent, and could be found more effectively in this way.
Furthermore, each event will has a profile of how they perform weekly, and will have some certain degree of dependency between other events. This points out some challenges:
- how can we build a model to detect the dependency between events, and the dependency between weekdays.
- the length of the REDD data set is approximately 36 days, which is too short to detect any patterns. So, I might need to simulate the large scale of energy consumption activities for the "virtual house". However, how to simulate the synthetic data that can replicate the real house is still unsure.
All the predictive model can be started from this point.
I started with the REDD dataset, with a couple of devices such as dishwasher, oven, and microwave. I converted the raw data into a list of ON-OFF events. Each event has a set of parameters such start time, duration, energy consumption. For example, the performance of the dishwasher of one house in REDD data can be seen as follows:

So, we can draw a dishwasher's distribution, which is looked like as follows:

This distribution does tell us that the dishwasher is most used between the consecutive days.
I have read a paper which mentioned that human's behaviour is on weekly (or daily) routines, so it does have some degree of regularity and predictability. And future prediction must be based on the assumption of determinism, so that the future events can be dependent on past events. Following to this idea, I convert from one single-dimensional time series into two dimensional matrix of weekdays and the state of the week that the event is turned ON-OFF. The data can be seen as follows:

Furthermore, each event will has a profile of how they perform weekly, and will have some certain degree of dependency between other events. This points out some challenges:
- how can we build a model to detect the dependency between events, and the dependency between weekdays.
- the length of the REDD data set is approximately 36 days, which is too short to detect any patterns. So, I might need to simulate the large scale of energy consumption activities for the "virtual house". However, how to simulate the synthetic data that can replicate the real house is still unsure.
All the predictive model can be started from this point.
Thursday, 15 December 2011
Modelling discussion
I have tried to build a probability model of user's events using Markov process. It is a simple model to calculate the probability of the next events that would occur in the next time step, based on the historical data. It uses the Markov property in which the next state depends only on the current state and not on the sequence of events that preceded it. It assumes the current state has all information from all previous state. This model can generate some results, however I don't think it generates a great result in our problem scenario.
As the labels can be dependent, therefore calculating the next state might require the information of some previous states, not just the current state. For example, we have an event sequence for using Washing Machine (WM). I assume the current state is today, which the WM is used, and we want to calculate the chance that the user will use the WM tomorrow. By applying Markov property, to estimate the probability of using WM tomorrow, we only need the information of the current state, which is the probability of using WM today. This probability is calculated from the historical data.
In a real scenario, using WM at the next state can be dependent on some previous use of WM in the past. Therefore, using Markov process in our model will not give a good result in prediction. However, we can use the model with Markov property as a bench mark to compare with other models, which I will research and implement.
I have read a paper of "A Model for Temporal Dependencies in Event Streams". They try to solve a very similar problem that I am trying to solve. They introduce the Piecewise-Constant Conditional Intensity Model (PCIM) to model the types and timing of events and capture the dependencies of each type of event on events in the past through a set of piecewise-constant conditional intensity functions. The model is very complicated, but I want to implement this model to FigureEnergy data. They apply Bayesian Network Learning in their model, so I will try to read and understand this area more.
As the labels can be dependent, therefore calculating the next state might require the information of some previous states, not just the current state. For example, we have an event sequence for using Washing Machine (WM). I assume the current state is today, which the WM is used, and we want to calculate the chance that the user will use the WM tomorrow. By applying Markov property, to estimate the probability of using WM tomorrow, we only need the information of the current state, which is the probability of using WM today. This probability is calculated from the historical data.
In a real scenario, using WM at the next state can be dependent on some previous use of WM in the past. Therefore, using Markov process in our model will not give a good result in prediction. However, we can use the model with Markov property as a bench mark to compare with other models, which I will research and implement.
I have read a paper of "A Model for Temporal Dependencies in Event Streams". They try to solve a very similar problem that I am trying to solve. They introduce the Piecewise-Constant Conditional Intensity Model (PCIM) to model the types and timing of events and capture the dependencies of each type of event on events in the past through a set of piecewise-constant conditional intensity functions. The model is very complicated, but I want to implement this model to FigureEnergy data. They apply Bayesian Network Learning in their model, so I will try to read and understand this area more.
Tuesday, 13 December 2011
Mathematical model for event prediction
Predicting user's activities is not an easy task. Specifically, the activities themselves are dependent to each other, and the information of activities are given in uncertain ways (i.e., it is hard to get fully correct information of events in reality).
Previously, I have tried Poisson processes to predict user's events, however it has been uncesseful model as the events are independents in Poisson process. Continuing researching for an appropirate model, I have had a good chat with Long about a model, still using Markov process. I think we came with an appealing model, which also works for dependent data. I am implementing the model with the data collected from the FigureEnergy system, however there is not enough information to conclude this model. For further testing, I will test it with a large appropriate data, which are released by MIT. Thanksfully the data can be obtained from Oli. I will try to implement this model asap for further analysis.
Then, I will have to define a scenario in a formal mathematical way, then an existing model will be chosen to implement as a benchmark for future comparison. In addition, the paper of "A model for Temporal Dependencies in Event Streams" will be needed to read and understand as well.
Previously, I have tried Poisson processes to predict user's events, however it has been uncesseful model as the events are independents in Poisson process. Continuing researching for an appropirate model, I have had a good chat with Long about a model, still using Markov process. I think we came with an appealing model, which also works for dependent data. I am implementing the model with the data collected from the FigureEnergy system, however there is not enough information to conclude this model. For further testing, I will test it with a large appropriate data, which are released by MIT. Thanksfully the data can be obtained from Oli. I will try to implement this model asap for further analysis.
Then, I will have to define a scenario in a formal mathematical way, then an existing model will be chosen to implement as a benchmark for future comparison. In addition, the paper of "A model for Temporal Dependencies in Event Streams" will be needed to read and understand as well.
Thursday, 8 December 2011
A quick update of my work.
In the last meeting, we discovered that the Poisson process is not a good model to apply in our scenario. It considers events are independent, while they are dependent in our case. Therefore, I need to switch to another appealing model, which should be done before 01 January 2012.
The strategy is to looking for models which work with dependent data. In addition, I need to gain much knowledge about machine learning and other mathematical models, so I am able to judge and select the right one.
I kick off with the paper of "Unsupervised Disaggregation of Low Frequency Power Measurements", which has been given by Oli. The paper mainly discusses the effectiveness of several unsupervised disaggregation methods using the factorial hidden Markov model on low frequency power measurements collected in real homes. In their model, the states of appliances are the hidden variables, and the aggregate power load is the observation. Therefore, they chose variants of Hidden Markov Model (HMM). More specially, they extend a Conditional Factorial Hidden Semi-Markov Model (CFHSMM), which allows the model to consider the dependencies between appliances and the dependencies on additional features, that I think is quite relevant to our case. Then, they apply machine learning process to estimate the parameters from the observations, and the hidden variables (which is the states of the appliances). Specifically, they use Expectation-Maximization algorithm (EM) to estimate the parameters, then using Maximum Likelihood Estimation (MLE) to estimate the hidden states.
In our case, the events are possibly annotated by users. So, I think Hidden Semi-Markov models could be used. I will check more references paper on CFHSMM to see if there is any relevant existing models.
Furthermore, I have grasped some book to read with the hope to have a better overal view on machine learning models. I will check out this list:
- Chapter 9: Mixture Models and EM (423-455) (book " Pattern Recognition and Machine Learning" - Christopher M. Bishop).
- Chapter 6: Bayesian Learning (154-199) (book: "Machine Learning" - Tom M. Mitchell).
The strategy is to looking for models which work with dependent data. In addition, I need to gain much knowledge about machine learning and other mathematical models, so I am able to judge and select the right one.
I kick off with the paper of "Unsupervised Disaggregation of Low Frequency Power Measurements", which has been given by Oli. The paper mainly discusses the effectiveness of several unsupervised disaggregation methods using the factorial hidden Markov model on low frequency power measurements collected in real homes. In their model, the states of appliances are the hidden variables, and the aggregate power load is the observation. Therefore, they chose variants of Hidden Markov Model (HMM). More specially, they extend a Conditional Factorial Hidden Semi-Markov Model (CFHSMM), which allows the model to consider the dependencies between appliances and the dependencies on additional features, that I think is quite relevant to our case. Then, they apply machine learning process to estimate the parameters from the observations, and the hidden variables (which is the states of the appliances). Specifically, they use Expectation-Maximization algorithm (EM) to estimate the parameters, then using Maximum Likelihood Estimation (MLE) to estimate the hidden states.
In our case, the events are possibly annotated by users. So, I think Hidden Semi-Markov models could be used. I will check more references paper on CFHSMM to see if there is any relevant existing models.
Furthermore, I have grasped some book to read with the hope to have a better overal view on machine learning models. I will check out this list:
- Chapter 9: Mixture Models and EM (423-455) (book " Pattern Recognition and Machine Learning" - Christopher M. Bishop).
- Chapter 6: Bayesian Learning (154-199) (book: "Machine Learning" - Tom M. Mitchell).
Thursday, 1 December 2011
Poisson Process prediction vs the actual data
In this post, I do some comparison between the actual events that used by the given user, and the predictive events using by PPs. I firstly take 14 training days to calculate the mean number of event types. From the given event file, there is only user ecenergy39 that has the maximum historical data of 17 days, therefore I only use this user to generate the results.
 As you can see from the above graph, by using 14 days as a training period, TV and Kettle are predicted to occur in the next 24 hours with the probability very high, approximately 80%. The actual results show that TV event has been annotated for 4 times, while "kettle" event has been annotated for 1 times.
Then, we use 15 days as a training period to predict the events occured in the next 24 hours. The result is below:
 The process is repeated for the 17th day, with the result as follows:

As we all know that the data of events are collected from the real experiment, where users manually annotated the information of the event. Therefore, the data itself has so much noise. We need to think of the solution of increase the accuracy of the event information. The direction could be automatically recognise the pattern of the events.

Then, we use 15 days as a training period to predict the events occured in the next 24 hours. The result is below:


As we all know that the data of events are collected from the real experiment, where users manually annotated the information of the event. Therefore, the data itself has so much noise. We need to think of the solution of increase the accuracy of the event information. The direction could be automatically recognise the pattern of the events.
User's Average Day Calculation (with more user's data)
I have been given more user's data of energy consumption, therefore I plotted again the average day for some specific users between the weekdays and weekend days. The following graphs show some results:


 With more data, the gap of energy consumed between the weekdays and the weekend days has become maller, and look regularly.


Subscribe to:
Posts (Atom)