Tuesday 29 November 2011

Apply Poisson process on FE labels

A Poisson process (PPs) is a collection {N(t), t>=0} of random variables, where N(t) is the number of events that have occured up to time t (starting from time 0). By using PPs, we can calculate the probablity of actual number of events that would be occured in the given period.

In our scenario, we have a list of the data of the events, which annotated by users using the FigureEnergy system. We want to use PPs to calculate the probability that event will be occured in the next time period (typically in daily unit). If the probability of the event to be occured is high (greater than 70%), we can ask the users to confirm the information. Then, we will be able to run the optimisation problem of minimising the carbon intensity, then we can send feedback to users by advising them using the events in the appropriate time.

To do that, firstly we filter all labels of the specific user. Then, we calculate the mean number of events per day. After that, we use PPs to calculate the probability of no labels which would be occureed in the next 24 hours. The results of the few users can be seen as follows:


From the graph above, we can tell the events that will be like occured in the next 24 hours. For example, for user "ecenergy39", the probability of using TV and Kettle in the next 24 hours are very high (greater than 80%).

Next step, I will check the accurate of the PPs prediction on the real FE data.

Meeting on 25 November 2011.

Pre-meeting notes on 25 Nov 2011.

1 – Tasks have been tackled:
·         Calculated and plotted user consumption in average day again in week days and weekend days. Different users show a different result. Interestingly, there is a correlation of consuming energy between the weekday and weekend days for the same user in average day.
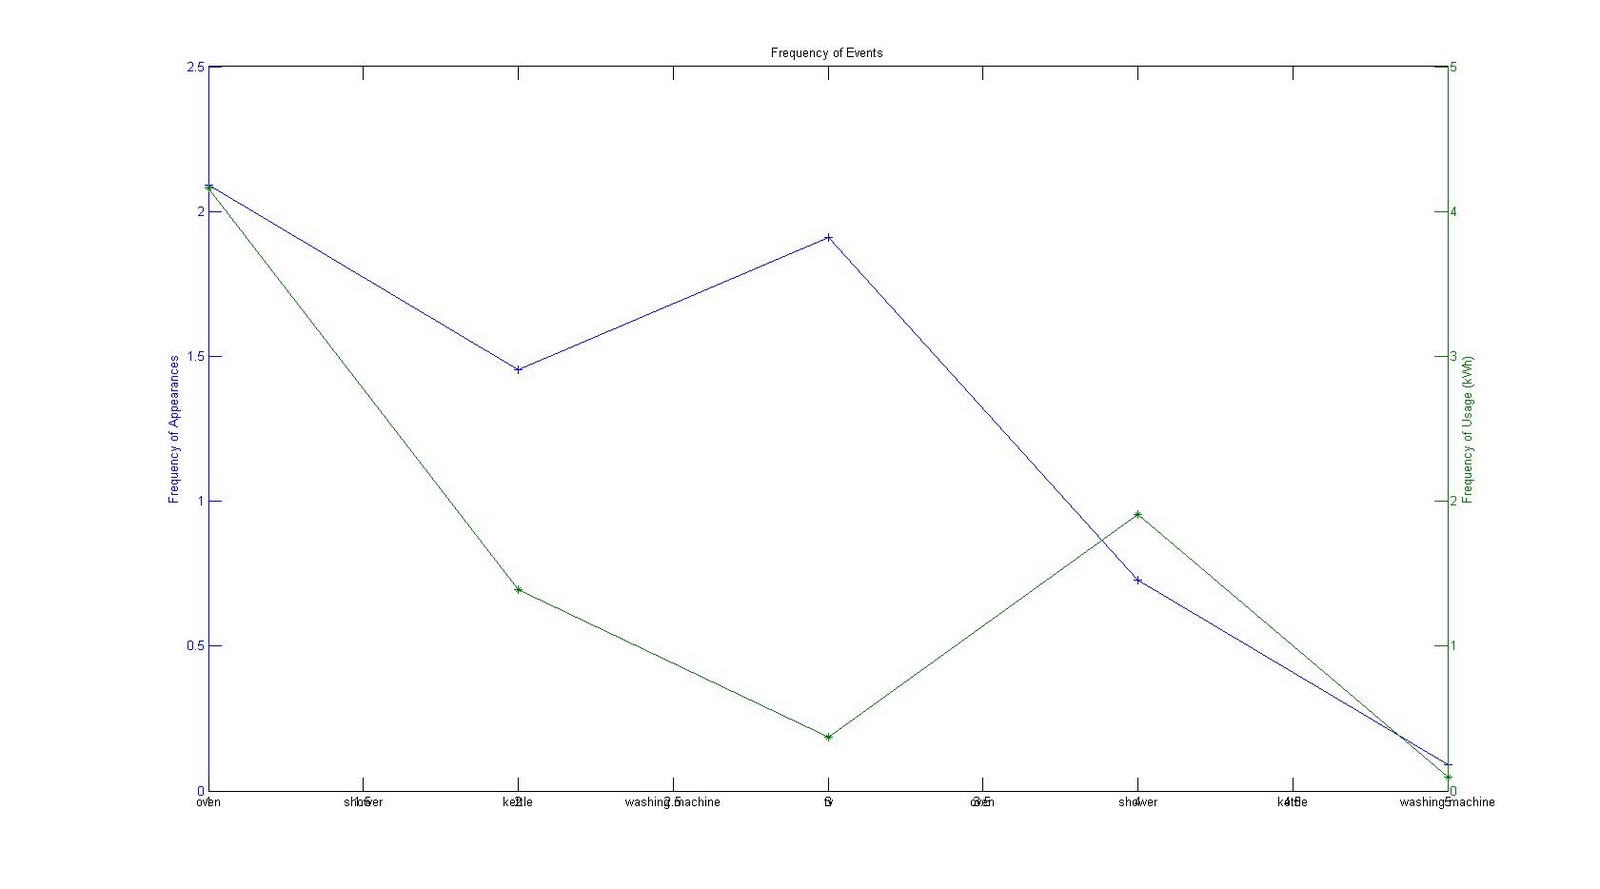
·         Plotted frequency of labels per day for both single users and all users.
·         Have done some reaching on Google scholar about event prediction and faults in machinery. I think I have obtained some nice papers but have not read them all.
·         Have read about Poisson process in the wiki. In addition, I have researched more tutorials and sections talking about Poisson process. I have gone through some examples and have understood some basic principles to apply to our case. Furthermore, I have prepared some calculation in draft to calculate the probability of events to appear at the given time step t. However, I have not yet successfully implemented in Matlab to generate the graph.
·         Have chatted with Rama about the problem that I am trying to tackle. I found it is hard to describe the issue in email, therefore I talked to him instead. The talk was just around events prediction and how to improve the event information as well as the prediction. He suggested some nice things, I summarise a few key things as follows:
·         As each event has its own energy usage. By using FE, the user annotates the event from the past history. By using this way, the information given from the user would have so much noise, and it is hard to tell the exact amount of energy that event would consume. Therefore, we should have a method to improve the certainty of event information. At the time being, I just assume that the events in FE would show the right information, including the time period and the usage of events.
·         Having predicted the events for a day ahead (I suppose this could be done by using Poisson process), how the agent system can improve the event prediction.
·         The optimisation of machine learning will focus on minimise both aggregate demand and events time.
·         Attended the probability course, which has been started intensively for 2 weeks.
2 – Remaining tasks:
·         Detect events based on peaks.
·         Read 1-2 related papers
·         Find existing work or models to apply to our situation.
·         Prepare emails to Steve Reece. (Not sure what I should say in here)

After meeting discussion:

3 – Next tasks:
·         Look, understand and implement Poisson distribution. Particularly, understand likelihood, Bayesian inference and confidence interval.
·         During the meeting, I and Enrico have a discussion about making a prediction of the specific event at the specific time. In my opinion, I think if we can predict the event at the specific time, then we can have an optimisation problem by minimising the carbon intensity based on scheduling the events. After that, this scheduling will be suggested to users. However, it could be impossible to correctly predict the events at the given time as they are controlled by the real human.
An alternative option is to predict the event to be happened in the next 24 hours, then we could make a suggestion to users to run the event at the other time to minimise the carbon intensity. The event with the probability is higher than 80% will be selected to suggest to users. Furthermore, we can calculate the difference between the worst case and the best case to advise users more effectively. However, how to run the optimisation without knowing the time, I am still not clear.


Thursday 24 November 2011

Frequency of labels for all users

I attended a probability lecture today. This probability course would be supposed to cover a whole range of anything related to distribution. Hence, the material is useful, but it is hard to follow.

Back to FigureEnergy data analysis, I plotted the frequency of labels per day for all users. The result is showed in Figure 1.0 as follows:

Figure 1.0 Frequency of labels appearances per day for all Users
I think Poison process can help to estimate the labels in the future based on the frequency of the appearances of labels. The annotated events data in FE seems so much noise, therefore we need to define a method the automatically recognise the events.
In addition, I will try to implement Poison process on the energy consumption, where the energy usages can be divided into smallers segments of energy usage. By using Poison process, I hope it can tell the highest probability of particular segment of energy usage for the given time.

Tuesday 22 November 2011

Frequency of events analysis

Different users have a list of their own activities during a day. These activities might have a chance to regconise as a pattern. To analyse this, we take the events which annotated from the real users during the FigureEnergy experiment to check the frequency of the type of events per day in term of appearance and energy usage. The results are shown as follows:

Figure 1. Frequency of events for user ecenergy22

Figure 2. Frequency of events for user ecenergy23

Figure 3. Frequency of events for user ecenergy24

Figure 4. Frequency of events for user ecenergy25

Figure 5. Frequency of events for user ecenergy30

Figure 6. Frequency of events for user ecenergy33

Figure 7. Frequency of events for user ecenergy34

Figure 8. Frequency of events for user ecenergy36

"Average Day" data again in weekday and weekend

I have plotted the "average day" usage again in weekday and weekend days from several users. The results are shown as follows:

Figure 1. Average day usage for user ecenergy22
Figure 2. Average day usage for user ecenergy23

Figure 3. Average day usage for user ecenergy25

Figure 4. Average day usage for user ecenergy30

Figure 5. Average day usage for user ecenergy32

Figure 6. Average day usage for user ecenergy33

Figure 7. Average day usage for user ecenergy34

Figure 8. Average day usage for user ecenergy35

Figure 9. Average day usage for user ecenergy36

Figure 10. Average day usage for user ecenergy37

Figure 11. Average day usage for user ecenergy38

Figure 12. Average day usage for user ecenergy39
The graph for those users above could be different if their usage data can be collected in at least 4 weeks.

Friday 18 November 2011

Meeting notes on 18/11/2011 (Revised version)

1 – List of Tasks from previous meeting:
      ·         Post a research plan in blog.

·         Plot user consumption hourly for some specific days.

·         Plot average day on different users.

2 – Discussion:

I have done all the previous tasks. Each individual user has a different profile of energy usage in “average day”. We might guess the energy behaviour and user’s lifestyle based on looking on these graphs.
 
3 – List of next tasks (sorted in order of priority)

·         Calculate and plot user consumption in “average day” again in week days and weekend days.

·         Plot frequency (on all labels) per day. Look further into the idea of detect the peak usage, from different thresholds.

·         Look further into detect events, based on peaks. Check the different signal, where y(t) = x(t) – x(t-1), where 1 is a time unit (currently time unit is 2 mins in FigureEnergy). Check to see if “low pass frequency” can apply anywhere in this part. Be aware of two types of statistics: user annotation, and peaks (e.g., washing machine has 2 peaks).

·         Research on Google scholar for “event prediction Gaussian”, predicting faults in machinery, and predicting “network traffic” and post what you would have found.

·         Look at “Poison process” in the wiki, check the relevant papers.

·         Read and summarise 1-2 papers weekly.

·         Try to find existing works in a different domain and translate those models to our situation, typically 2-3 existing models.

·         Look and report on research where agents to keep calendars and agents to book rooms. (probably from http://teamcore.usc.edu/)

·         Prepare an email to ask agent’s research fellow (Sid, Rama, Greg) to ask about their suggestion on the relevant mathematical model that I should use.

·         Prepare an email and a dataset (in .csv format) to send to Steve Reece about how to proceed with the prediction.

·         Improve English (I have attended the Academic Writing English course (1 hour/week, in 6 weeks), however I found it would not help much in my situation. It showed some principle of how to make a good writing structure and talk a bit about everything, but it is not enough for me. I think I might look for a paid tutor to improve this weakness. At the time being, I will try to revise my blog and might get someone to check the writing. I might need to read at Oli’s blog to learn the informal writing style as well).

·         Optional:

·         Register course in probability

·         Register online course in Machine Learning (web-seminar from Stanford University)

·         Read paper: “A decision-Theoretic Approach to Cooperative Control and Adjustable Autonomy”

Pre-meeting notes on 18/11/2011.

1 – List of Tasks from previous meeting:

·         Post a research plan in blog.

·         Plot user consumption hourly for some specific days.

·         Plot average day on different users.


2 – Discussion:

I have done all the previous tasks. Each individual user has a different profile of energy usage in “average day”. We might guess the energy behaviour and user’s lifestyle based on looking on these graphs.


3 – List of next tasks (sorted in order of priority)

·         Calculate and plot user consumption in “average day” again in week days and weekend days.

·         Research on Google scholar for “event prediction Gaussian”, “predicting faults in machinery”, and predicting “network traffic” and post what you would have found.

·         Try to find existing works in a different domain and translate those models to our situation, typically 2-3 existing models.

·         Look and report on research where agents to keep calendars and agents to book rooms.

·         Look for the existing infrastructure on Google calendar, ICS format.

·         Prepare an email and a dataset (in .csv format) to send to Steve Reece about how to preceed with the prediction.

·         Improve English (I have attended the Academic Writing English course (1 hour/week, in 6 weeks), however I found it would not help much in my situation. It showed some principle of how to make a good writing structure and talk a bit about everything. I think I might look for a paid tutor to improve this weakness).

·          Look into frequency in term of user-generated events, the basis of power level, or the time it takes between two instant where power goes above x.

·         Optional:

·         Register course in probability

·         Register online course in Machine Learning (web-seminar from Stanford University)

·         Read paper: “A decision-Theoretic Approach to Cooperative Control and Adjustable Autonomy”

"Average Day" data plotting.

I have plotted an energy consumption of "average day" for different users. The results will be shown as follow:
Figure 1.0 - Average Day consumption for User ecenergy22 in 14 days
Figure 2.0 - Average Day consumption for User ecenergy23 in 11 days
Figure 3.0 - Average Day consumption for User ecenergy24 in 10 days
Figure 4.0 - Average Day consumption for User ecenergy25 in 7 days
Figure 5.0 - Average Day consumption for User ecenergy30 in 7 days
Figure 6.0 - Average Day consumption for User ecenergy32 in 18 days
Figure 7.0 - Average Day consumption for User ecenergy33 in 17 days
Figure 8.0 - Average Day consumption for User ecenergy34 in 11 days
Figure 9.0 - Average Day consumption for User ecenergy35 in 11 days
Figure 10.0 - Average Day consumption for User ecenergy36 in 12 days

Friday 11 November 2011

Hourly consumption analysis

I have calculated an energy of user consumption in every hour to see if we can observe any patern, which could help to improve the prediction. I firstly run a whole data of user ecenergy22. The result can be seen in Figure 1.0 below:

Figure 1.0 User consumption in every hour.

Then, I generate the results in the first 13 days for an ease of observation. The following figures shows the daily user consumption in every hour unit.
Figure 2.1 User consumption on 06/09/2011.

Figure 2.2 User consumption on 07/09/2011.
Figure 2.3 User consumption on 08/09/2011.
Figure 2.4 User consumption on 09/09/2011.

Figure 2.5 User consumption on 10/09/2011. 
Figure 2.6 User consumption on 11/09/2011
Figure 2.7  User consumption on 12/09/2011.

Research Plan after prediction.

As promised, I rewrite my research plan here for your suggestion. So far, I have got GPs prediction running on the UK Carbon Intensity. The result of the UK carbon intensity can be acceptable. However, the prediction of the specific user consumption by GPs based on historical data is hard, probably impossible to formulate a reasonable covariance function. Hence, we need to use the annotated events from FigureEnergy system, (or even Non-Intrusive Load Monitoring (NILM) technique) to predict activities ahead, and improve the user demand prediction.

I assume those prediction, which mentioned above, could be done. After that, we focus on providing feedback such that users can be raised awareness of carbon intensity based on their everyday activities. Up to this point, we can have two options:

1 - From historical data, we can do some analysis and show information of devices usage and carbon intensity. From this information, we hope users can have more attention on their energy usage, so they can change their behaviour in a positive way.

2 - From the prediction, we can run optimisation to minimise the carbon intensity. Then, we can advise some action to users to reduce the carbon intensity in term of the use of their devices. Probably we can suggest users to defer some events from the high peak of the grid carbon intensity to other low peak.

Furthermore, we want to think of the feedback interface where users can colaborate with agents to plan their activities ahead.

Thursday 10 November 2011

User consumption prediction analysis

Honestly it is really hard to predict the user consumption by using GPs. Previously, I have tried to run a few examples on the real user usage, unfortunately the result were not good. I think to be able to do that, we need some help from the users, who directly use their home devices.

People (or users) often have a plan of what they are going to do, typically day-ahead or week-ahead. Specifically, with the help of technology, they can do planning in their own calendar (e.g, google calendar), then synchonises all activities to their phone for the notification and better time management. Therefore, I think if we can access to this type of information, or if we can get users to support the prediction by working with the agent, we can predict more accurately. However, I am still not too sure how we can do that.

Back to the user consumption prediction analysis, I try to do some analysis on the labels, which were annotated by the users, to see if we can get something from there. I firstly imported the list of events from the excel file. In this file, it has the annotated labels for all users, then we need to filter the data of the specific user to do some test. After that, I sort the data in ascending order of the starting time of the event. Then, I do some calculation on labels so that each label has a starting time step t, running for a length of s. Each label contains an energy usage as well as a baseline usage, however we only want to focus on energy usage at this time.

Up to this stage, we have a list of labels in which each label has a name, a starting time step t, the length of a running time, and an usage. For example, kettle starts at time 3 to 7, with a consumption of 0.2023 kWh; washing machine runs from time 7 to 11, with a consumption of 0.305 kWh. I wonder how we can apply GPs to predict the future labels, as each label can has 3 parameters (label name, time, and consumption). One solution I can think of is to break down the list of labels to individual single category, for example under the label category such as kettle, washing machine,..., then apply GPs to predict time and usage. Hence, we aggregate all single prediction to get the final graph. I am not sure at this stage and looking for a suggestion.

In addition, Poison process can be used to calculate the probability of the labels, which should appear in the time step t'. But how can we combine the Poison process and GPs to make a good prediction, I still have not figure it out yet.

Wednesday 2 November 2011

Total Daily Carbon Intensity in the UK - Plot and Prediction Analysis.

I try to analyse the data of Carbon Intensity in the UK. By getting the total daily carbon intensity in the UK, we can see the shape of the graph below (see figure 1).

Figure 1. Actual Total Daily Carbon Intensity in the UK (from 27 June 2011 to 27 September 2011)
As we can see in Figure 1, the carbon intensity during the weekday is apparently higher than the carbon intensity during the weekend.

After that, I apply a Single GPs prediction for the total daily carbon intensity in the UK. The initial training data set is the first 4 weeks (28 days), the predictive period starts from 29 to 92. In this prediction, I only apply one-day ahead prediction. For example, if we want to predict the carbon intensity for the day of 35, then I would consider the training data set is from 1 to 34. The result is in figure 2 below.

Figure 2. Prediction of Daily Total Carbon Intensity
The Mean Square Error (MSE) for this period of 64 days is 1944838. For more detail, Figure 3 shows the MSE for individual days during the predictive period.

Figure 3. MSE for Total Daily Carbon Intensity during the predictive period.

Let's look into further detail by predict Carbon Intensity for a day ahead, however we predict every half-an-hours instead of the total daily value. Previously, I only used the constant hyperparameter because it is time-consuming. This time, I use the initial training data set of 28 days, started from 27 June 2011. The predictive period is from the day of 29th to 58th. The hyperparameter is iterately trained everyday during the predictive period. Having waited a few hours (approximately 4 hours), Figue 4 below shows the result.

Figure 4. Single GPs on Carbon Intensity oneday ahead in the UK (with trained hyperparameters), started from 27 June 2011.
The MSE for this 30 days predictive period is 1000, which is very much improved. In addition, Figure 5.0 shows the MSE for this period in detail.

Figure 5.0. MSE of Single GPs on Carbon Intensity One Day Ahead, Every Half An Hour prediction.

Furthermore, we analyse an energy consumption of some real users. First of all, I plot the total daily of user's energy usage. These figures can be seen as following:

Figure 6.1. Daily Total Usage of User 1.
Figure 6.2. Daily Total Usage of User 2.
Figure 6.3. Daily Total Usage of User 3.
Figure 6.4. Daily Total Usage of User 4.
Figure 6.5. Daily Total Usage of User 5.

By using the same covariance function, which applied in Carbon Intensity prediction, I have tried to run some prediction. However, the result looks really bad. The covariance function for user's consumption has to be much different, which I still have not found out yet. Moreover, the resolution for the user's usage is every two minute, which is quite high. It typically takes much time to run the file and wait for the result. Particularly, when the training hyperparameter is applied, the waiting time could be take for a few hours.

I might need to reduce the resolution for the data of user's usage to do more test on GPs prediction.