A new home energy dataset can be used to create a list of energy consumption activities is Smart* dataset. The information can be found at this link: http://traces.cs.umass.edu/index.php/Smart/Smart.
They have two house: B, and C that measured the aggregate electrical data, and environmental data; and House A that measured the aggregated energy consumption as well as electrical data from individual energy meters. As we are only interested in the individual appliances, so House A could be a dataset.
In house A, basically they recorded all sub-meters in 3 months, started from 01 May 2012 to 31 July 2012.
There are 91 days. Each day contains a list of labels, timestamp, and real power consumption at that timestamp. The resolution is about 3 seconds.
I attempted to get the data of every single event/label during these 3 months. The aim is to convert these dataset so that it would look like REDD dataset. Then, I can apply similar methods to get the list of ON-OFF EVENTS.
The first task is to separate the timestamp, and power usage of each label to single file. Having done that, it showed 53 labels altogether. To this far, the data should be looked at REDD dataset. Then, I converted these files to list of ON-OFF EVENTS.
I manually check the output. Surprisingly, majority of labels doesn't have data. For some reason, there are only few data on some irrelevant labels such as basement-dehumidifier, basement-freezer, bedroom-ac, kitchen-coffeepot, kitchen-toaster, livingroom-tv, master-fan. It is roughly 10/53 labels that working fine.
They don't have the data for major appliances like washing machine, microwave,...
This is a shame, because I have had a hope for this dataset.
Now I know it is unused for me. Such a waste of time :(.
Friday, 5 October 2012
Thursday, 4 October 2012
Convert REDD & FigureEnergy raw data
I have finished the code of the mixture model of EGH extension, the prediction performance of this model is better as I expected, so it's good. More tests are required to confirm how robust the algorithm would be.
There are two real dataset: i) REDD, and ii) FigureEnergy. For the previous algorithm, I have converted these raw dataset into some machine readable using Matlab. However, it is such a pain to reuse the code, and generate the new format type of inputs by navigating the Matlab's code. So, I have switched to Python, which is objected-oriented and much easy to navigate the objects as well as function.
In REDD raw dataset, there are 6 houses. Each house consists of a list of appliances, measured the energy consumption by sub-meters. The energy consumption of each appliance is recorded every 3 seconds. As I am interested in predicting events, so I need to convert the raw dataset into ON-OFF Events. The algorithm is performed as follows:
- Firstly, set a threshold of energy consumption (typically 55W), store all segments that the appliances turned on.
- Secondly, set a GAP allowance parameter for two consecutive segments. If the gap between two consecutive segments are greater than the GAP allowance, we connect these two segments altogether, and considered as one segment.
- Thirdly, select the NOISE removal parameter, then filter all the segment that the duration is less then the Noise parameter.
In FigureEnergy dataset, the list of events does come altogether as one list. So, the idea is to program in Python to separate the appliances for every users to every single files. This is only required time-devoted for coding.
At the moment, the problem with REDD, and FigureEnergy data is the number of days that the dataset can give is small, and not enough to test how robust the prediction algorithm would perform. The solution could be to sample more data from the empirical distribution for every single appliances.
Wednesday, 3 October 2012
EGH_Extension
In the past, I have used a model, called "Mixture model of EGHs" to predict the next activity ahead. The idea is to analyse the past occurrences of the target event that we would like to predict. By looking the preceding window of the past occurrences, we can create a single sequence of these preceding sequences. The statistical mixture model could be generate to summarise this training dataset, so we can use this model to predict whether or not the target event would occur in the next time slot, given the recent window sequence of events.
The original algorithm of mixture model of EGHs considers all the occurrences of the events in the past. By applying to the home energy management scenario, we have observed that the day of the week is one of the important factor for the homeowners to decide which appliances/events/activities they could use. For example, the activities are obviously different between weekdays and weekends. This is because the homeowner' behaviours can be impacted by others external factors such as local weather, working hours, social activities.
Thus, taking the weekday as an important factor to predict the future events/activities, we can extend EGH algorithm. Instead of computing all past occurrences of the target event (i.e., the event that we would like to predict), we only consider the past occurrences that occurred to the same weekday that we would want to predict.
For example, if we want to predict occurrences of "washing machine" on next Tuesday, we only analyse the past preceding sequences that had the "washing machine" running on Tuesday.
By doing so, we might catch the patterns between appliances/activities and improve the prediction.
As the human's routines are best described daily, and weekly. The size of preceding window should be 7 days (1 week).
I have finished the code. Debugging at the moment...
Friday, 28 September 2012
Empirical Analysis
Having applied two state of the art algorithm from two other domains, I found that these algorithms might not work well in my home energy management scenario and could be difficult to extend the models because I don't have a clear idea how the real energy consumption activities performed in the home. Thus, I decided to go back to the real data and do some empirical analysis on some devices with the hope that I could find something interesting.
I started with the REDD dataset, with a couple of devices such as dishwasher, oven, and microwave. I converted the raw data into a list of ON-OFF events. Each event has a set of parameters such start time, duration, energy consumption. For example, the performance of the dishwasher of one house in REDD data can be seen as follows:

So, we can draw a dishwasher's distribution, which is looked like as follows:

This distribution does tell us that the dishwasher is most used between the consecutive days.
I have read a paper which mentioned that human's behaviour is on weekly (or daily) routines, so it does have some degree of regularity and predictability. And future prediction must be based on the assumption of determinism, so that the future events can be dependent on past events. Following to this idea, I convert from one single-dimensional time series into two dimensional matrix of weekdays and the state of the week that the event is turned ON-OFF. The data can be seen as follows:
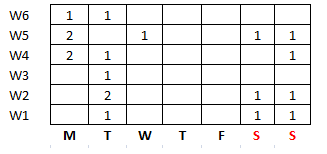 In this table, we can see quite clearly that the user does not use the dishwasher on Thursday, and Friday, and likely to use once between Monday, and Tuesday. Also, he is likely to use in the weekend. The pattern is quite apparent, and could be found more effectively in this way.
Furthermore, each event will has a profile of how they perform weekly, and will have some certain degree of dependency between other events. This points out some challenges:
- how can we build a model to detect the dependency between events, and the dependency between weekdays.
- the length of the REDD data set is approximately 36 days, which is too short to detect any patterns. So, I might need to simulate the large scale of energy consumption activities for the "virtual house". However, how to simulate the synthetic data that can replicate the real house is still unsure.
All the predictive model can be started from this point.
I started with the REDD dataset, with a couple of devices such as dishwasher, oven, and microwave. I converted the raw data into a list of ON-OFF events. Each event has a set of parameters such start time, duration, energy consumption. For example, the performance of the dishwasher of one house in REDD data can be seen as follows:

So, we can draw a dishwasher's distribution, which is looked like as follows:

This distribution does tell us that the dishwasher is most used between the consecutive days.
I have read a paper which mentioned that human's behaviour is on weekly (or daily) routines, so it does have some degree of regularity and predictability. And future prediction must be based on the assumption of determinism, so that the future events can be dependent on past events. Following to this idea, I convert from one single-dimensional time series into two dimensional matrix of weekdays and the state of the week that the event is turned ON-OFF. The data can be seen as follows:

Furthermore, each event will has a profile of how they perform weekly, and will have some certain degree of dependency between other events. This points out some challenges:
- how can we build a model to detect the dependency between events, and the dependency between weekdays.
- the length of the REDD data set is approximately 36 days, which is too short to detect any patterns. So, I might need to simulate the large scale of energy consumption activities for the "virtual house". However, how to simulate the synthetic data that can replicate the real house is still unsure.
All the predictive model can be started from this point.
Subscribe to:
Posts (Atom)