Having applied two state of the art algorithm from two other domains, I found that these algorithms might not work well in my home energy management scenario and could be difficult to extend the models because I don't have a clear idea how the real energy consumption activities performed in the home. Thus, I decided to go back to the real data and do some empirical analysis on some devices with the hope that I could find something interesting.
I started with the REDD dataset, with a couple of devices such as dishwasher, oven, and microwave. I converted the raw data into a list of ON-OFF events. Each event has a set of parameters such start time, duration, energy consumption. For example, the performance of the dishwasher of one house in REDD data can be seen as follows:
So, we can draw a dishwasher's distribution, which is looked like as follows:
This distribution does tell us that the dishwasher is most used between the consecutive days.
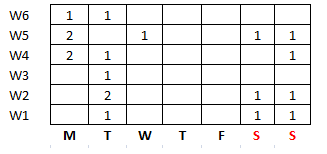
I have read a paper which mentioned that human's behaviour is on weekly (or daily) routines, so it does have some degree of regularity and predictability. And future prediction must be based on the assumption of determinism, so that the future events can be dependent on past events. Following to this idea, I convert from one single-dimensional time series into two dimensional matrix of weekdays and the state of the week that the event is turned ON-OFF. The data can be seen as follows:
In this table, we can see quite clearly that the user does not use the dishwasher on Thursday, and Friday, and likely to use once between Monday, and Tuesday. Also, he is likely to use in the weekend. The pattern is quite apparent, and could be found more effectively in this way.
Furthermore, each event will has a profile of how they perform weekly, and will have some certain degree of dependency between other events. This points out some challenges:
- how can we build a model to detect the dependency between events, and the dependency between weekdays.
- the length of the REDD data set is approximately 36 days, which is too short to detect any patterns. So, I might need to simulate the large scale of energy consumption activities for the "virtual house". However, how to simulate the synthetic data that can replicate the real house is still unsure.
All the predictive model can be started from this point.


No comments:
Post a Comment