Thursday, 1 December 2011

Poisson Process prediction vs the actual data

In this post, I do some comparison between the actual events that used by the given user, and the predictive events using by PPs. I firstly take 14 training days to calculate the mean number of event types. From the given event file, there is only user ecenergy39 that has the maximum historical data of 17 days, therefore I only use this user to generate the results.
As you can see from the above graph, by using 14 days as a training period, TV and Kettle are predicted to occur in the next 24 hours with the probability very high, approximately 80%. The actual results show that TV event has been annotated for 4 times, while "kettle" event has been annotated for 1 times.

Then, we use 15 days as a training period to predict the events occured in the next 24 hours. The result is below:

The process is repeated for the 17th day, with the result as follows:


As we all know that the data of events are collected from the real experiment, where users manually annotated the information of the event. Therefore, the data itself has so much noise. We need to think of the solution of increase the accuracy of the event information. The direction could be automatically recognise the pattern of the events.

User's Average Day Calculation (with more user's data)

I have been given more user's data of energy consumption, therefore I plotted again the average day for some specific users between the weekdays and weekend days. The following graphs show some results:


With more data, the gap of energy consumed between the weekdays and the weekend days has become maller, and look regularly.

Tuesday, 29 November 2011

Apply Poisson process on FE labels

A Poisson process (PPs) is a collection {N(t), t>=0} of random variables, where N(t) is the number of events that have occured up to time t (starting from time 0). By using PPs, we can calculate the probablity of actual number of events that would be occured in the given period.

In our scenario, we have a list of the data of the events, which annotated by users using the FigureEnergy system. We want to use PPs to calculate the probability that event will be occured in the next time period (typically in daily unit). If the probability of the event to be occured is high (greater than 70%), we can ask the users to confirm the information. Then, we will be able to run the optimisation problem of minimising the carbon intensity, then we can send feedback to users by advising them using the events in the appropriate time.

To do that, firstly we filter all labels of the specific user. Then, we calculate the mean number of events per day. After that, we use PPs to calculate the probability of no labels which would be occureed in the next 24 hours. The results of the few users can be seen as follows:


From the graph above, we can tell the events that will be like occured in the next 24 hours. For example, for user "ecenergy39", the probability of using TV and Kettle in the next 24 hours are very high (greater than 80%).

Next step, I will check the accurate of the PPs prediction on the real FE data.

Meeting on 25 November 2011.

Pre-meeting notes on 25 Nov 2011.

1 – Tasks have been tackled:
·         Calculated and plotted user consumption in average day again in week days and weekend days. Different users show a different result. Interestingly, there is a correlation of consuming energy between the weekday and weekend days for the same user in average day.
·         Plotted frequency of labels per day for both single users and all users.
·         Have done some reaching on Google scholar about event prediction and faults in machinery. I think I have obtained some nice papers but have not read them all.
·         Have read about Poisson process in the wiki. In addition, I have researched more tutorials and sections talking about Poisson process. I have gone through some examples and have understood some basic principles to apply to our case. Furthermore, I have prepared some calculation in draft to calculate the probability of events to appear at the given time step t. However, I have not yet successfully implemented in Matlab to generate the graph.
·         Have chatted with Rama about the problem that I am trying to tackle. I found it is hard to describe the issue in email, therefore I talked to him instead. The talk was just around events prediction and how to improve the event information as well as the prediction. He suggested some nice things, I summarise a few key things as follows:
·         As each event has its own energy usage. By using FE, the user annotates the event from the past history. By using this way, the information given from the user would have so much noise, and it is hard to tell the exact amount of energy that event would consume. Therefore, we should have a method to improve the certainty of event information. At the time being, I just assume that the events in FE would show the right information, including the time period and the usage of events.
·         Having predicted the events for a day ahead (I suppose this could be done by using Poisson process), how the agent system can improve the event prediction.
·         The optimisation of machine learning will focus on minimise both aggregate demand and events time.
·         Attended the probability course, which has been started intensively for 2 weeks.
2 – Remaining tasks:
·         Detect events based on peaks.
·         Read 1-2 related papers
·         Find existing work or models to apply to our situation.
·         Prepare emails to Steve Reece. (Not sure what I should say in here)

After meeting discussion:

3 – Next tasks:
·         Look, understand and implement Poisson distribution. Particularly, understand likelihood, Bayesian inference and confidence interval.
·         During the meeting, I and Enrico have a discussion about making a prediction of the specific event at the specific time. In my opinion, I think if we can predict the event at the specific time, then we can have an optimisation problem by minimising the carbon intensity based on scheduling the events. After that, this scheduling will be suggested to users. However, it could be impossible to correctly predict the events at the given time as they are controlled by the real human.
An alternative option is to predict the event to be happened in the next 24 hours, then we could make a suggestion to users to run the event at the other time to minimise the carbon intensity. The event with the probability is higher than 80% will be selected to suggest to users. Furthermore, we can calculate the difference between the worst case and the best case to advise users more effectively. However, how to run the optimisation without knowing the time, I am still not clear.


Thursday, 24 November 2011

Frequency of labels for all users

I attended a probability lecture today. This probability course would be supposed to cover a whole range of anything related to distribution. Hence, the material is useful, but it is hard to follow.

Back to FigureEnergy data analysis, I plotted the frequency of labels per day for all users. The result is showed in Figure 1.0 as follows:

Figure 1.0 Frequency of labels appearances per day for all Users
I think Poison process can help to estimate the labels in the future based on the frequency of the appearances of labels. The annotated events data in FE seems so much noise, therefore we need to define a method the automatically recognise the events.
In addition, I will try to implement Poison process on the energy consumption, where the energy usages can be divided into smallers segments of energy usage. By using Poison process, I hope it can tell the highest probability of particular segment of energy usage for the given time.

Tuesday, 22 November 2011

Frequency of events analysis

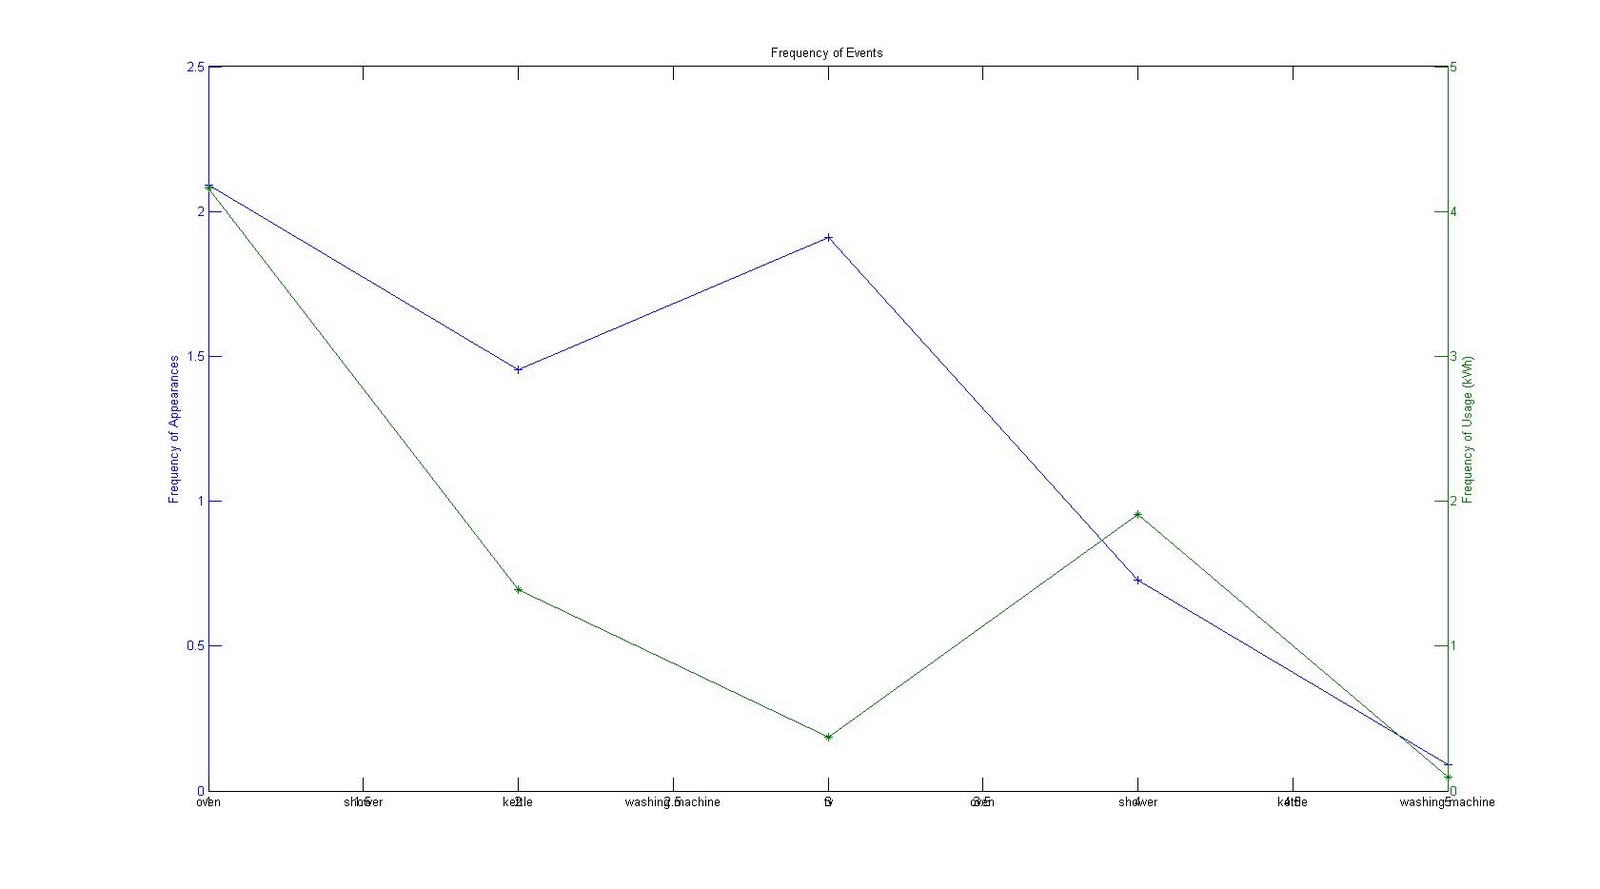
Different users have a list of their own activities during a day. These activities might have a chance to regconise as a pattern. To analyse this, we take the events which annotated from the real users during the FigureEnergy experiment to check the frequency of the type of events per day in term of appearance and energy usage. The results are shown as follows:

Figure 1. Frequency of events for user ecenergy22

Figure 2. Frequency of events for user ecenergy23

Figure 3. Frequency of events for user ecenergy24

Figure 4. Frequency of events for user ecenergy25

Figure 5. Frequency of events for user ecenergy30

Figure 6. Frequency of events for user ecenergy33

Figure 7. Frequency of events for user ecenergy34

Figure 8. Frequency of events for user ecenergy36

"Average Day" data again in weekday and weekend

I have plotted the "average day" usage again in weekday and weekend days from several users. The results are shown as follows:

Figure 1. Average day usage for user ecenergy22
Figure 2. Average day usage for user ecenergy23

Figure 3. Average day usage for user ecenergy25

Figure 4. Average day usage for user ecenergy30

Figure 5. Average day usage for user ecenergy32

Figure 6. Average day usage for user ecenergy33

Figure 7. Average day usage for user ecenergy34

Figure 8. Average day usage for user ecenergy35

Figure 9. Average day usage for user ecenergy36

Figure 10. Average day usage for user ecenergy37

Figure 11. Average day usage for user ecenergy38

Figure 12. Average day usage for user ecenergy39
The graph for those users above could be different if their usage data can be collected in at least 4 weeks.